I’m not sure if this should be reported as a bug but there is an issue with the current modeling in the WvW ratings system. I assume that this link is still a valid description of the strength of victory modeling. https://forum-en.gw2archive.eu/forum/game/wuv/The-math-behind-WvW-ratings/first#post2034699
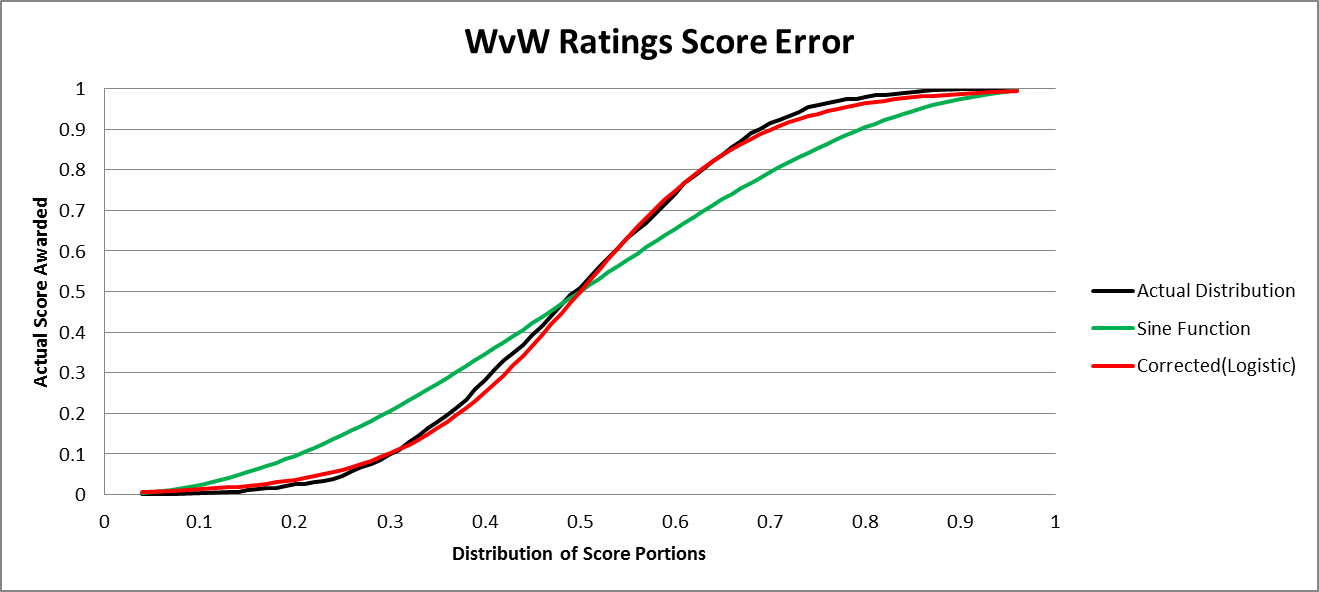
The problem is that the Sine function model that is currently used to award the actual score in the glicko rating deviates considerably from the actual real distribution of results. I retrieved a history of scores from http://mos.millenium.org/na/matchups and parsed the results and converted the scores into the portions used by the Anet Glicko system. I then converted that distribution into a probability distribution that the rating system uses to assign the “actual” score that is use to correct the ratings. I’ve attached an image of the plots that I did for this explanation.
The black curve is the real distribution of scores. It was normally distributed about 0.5 with a SD of 0.15.
The Green curve is the Sine function curve that is currently used. This curve currently over rewards lower performing servers and under rewards higher performing servers. The worst error occurs at 0.7 and 0.3 on the x axis. In these locations the error is about 0.11. this means that higher performing servers (0.7) performing in this range are getting about a 10% penalty in score and the lower performing (0.3) server is getting a 10% bonus. It doesn’t matter what your server rating is, if you perform in the error range you being rewarded improperly.
The real problem with this is when a server is expected to have a really high score not to lose rating points. The best example of this right now is Dragonbrand (1839.9965). They are currently competing against Stormbluff Isle (1667.1971) and Maguuma (1534.7854).
According the current system, Dragonbrand would have an expected score of 0.71 against Stormbluff Isle. According to the sine function currently used, they would Dragonbrand would need to have a score portion of 0.64. But according to the real data all that should be required to achieve that score is 0.59. That 0.05 difference is significant over the course of the week where the overall proportion shrinks as the scores go up. Against Maguuma the situation is worse. The Sine function requires a portion of 0.73 when only a 0.65 is justified by the historical data. The conclusion is that Dragonbrand (and any top ranked server in a teir) must work harder than necessary not to be pulled back down. And the lower ranked servers will have an easier time pull the top down.
If the servers were pooled and randomly competed this wouldn’t be a problem. It would simply result in a virtual floor and ceiling for the ratings. Downward pressure on the top and upward pressure on the bottom. Everything pushed to the middle. But when you have tiers, this makes Tier mobility difficult. Servers pushing up have to put forth a monumental effort to break in to the next tier and the servers on the bottom of the a Tier get protected by the system even after they stop performing at a level worthy of their tier. To be more blunt, it screws servers like Dragonbrand and Tarnished Coast and benefits servers like Blackgate and Sea of Sorrows who have had long periods of poor performance and still refuse to drop down to the next tier.
In a Strength of Victory system like the one Anet is using, the score awarded should be consistent with the distribution of the historical scoring data. I understand that when a system is initiated and there is no data to reference you must guess. But now there is plenty of data to use for reference.
I’m not sure where the Sine function came from but modeling normally distributed data can be done with a logistic curve much more easily. I believe this is why Elo used it. I have modeled a logistic curve to fit the historical data and it shown in the chart as the red line. The sigmoid midpoint is 0.5, and the k value is 10.91. This k value gives the lowest sum of squares of the difference between the historical data and the logistic model.
You should consider fixing this to reward hard working servers that are trying to push up the ranks and maybe more importantly to properly punish servers that are coasting at the bottom of upper tiers.
Just as an aside, reducing the range of the MMR variability by capping it at 100 has also aggravated the problem because it forces servers like Dragonbrand and Tarnished Coast to compete against lower ranked servers more often which keeps them weighed down.
I’ve also attached a csv of some of the derived data. I’ve included column headers but it is still a bit messy.
Columns
Proportion: a score proportion
Count: The number of times the proportion block (by 0.01) appeared.
Cumulative: Cumulative count.
%cumulative: total Probability distribution of real proportions data.
Sine: the result of the proportion as a function of the Sine function currently used.
Corrected: The result of the proportion as a function of the logistic function.
diff^2: squared diff of %cumulative and Corrected.
EDIT: Changed the x axis on the graph to be more consistent with my comments.
Attachments:
(edited by TorquedSoul.8097)


