Attachments:
(edited by fadeaway.2807)
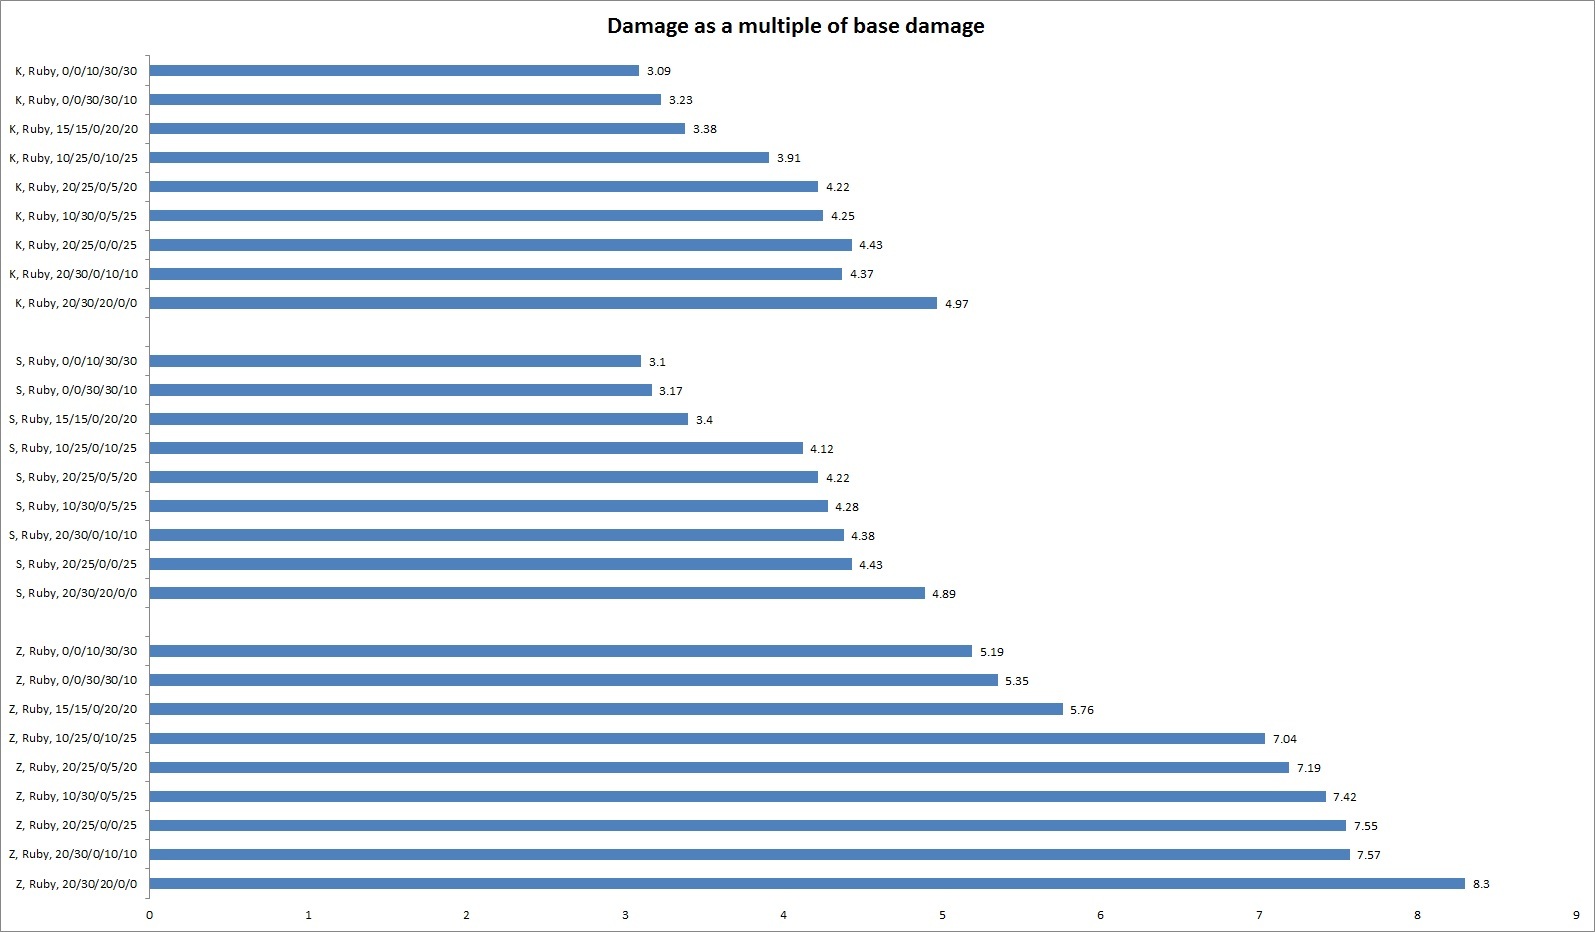
Thought this might be useful to some people.
I’ve put a selection of specs into my own personal effective power spreadsheet to find out each spec’s relative damage in comparison to base stats (916 pwr, 4% crit etc).
Some variables you may want to know:
I assume 5 percent damage from virtue 25.
I assume 100 percent fury up time.
All specs besides the obviously hammer ones (at least 20 in night honor) receive 2 extra stacks of might.
Gear is always zerker and ruby orbs or soldier and traveler runes, represented by either a Zor an S on the vertical axis.
Where weapon swap is worth it, I assume 60:40 ratio of greatsword to 1h sword.
The gaps would widen if you add might stacks, sigil of force, and scholar runes.

(edited by fadeaway.2807)
I don’t see my build in there.
>:(
Which one is that?
Which one is that?
https://forum-en.gw2archive.eu/forum/professions/guardian/The-Virtuous-Blade-Build/first#post3191398
But, I’m really just teasing. :p
Out of curiousity, I’m assuming you’re adding traits that are only DPS oriented and not necessarily support on your chart?
I only really bothered with what I knew to be common choices, and tried to avoid duplication between specs with no huge difference.
I think the one you linked would slot in slightly less than the 10/25/0/10/25 build, due to it being 5 percent less dmg mods from zeal but 10 more dmg mods from radiance, plus the 100 power for 250 precision.
And yes, where applicable I only consider zeal 2, zeal 7, virtue 6, virtue whatever the condi removal is, 1h dmg/crit and sup aria.
Pretty much yes. Though that site does things in terms of effective power while I compare in relation to a base number of 1 as a multiple. In fact my numbers are effective power divided by 916 because 916 piwer and no other stats is the starting point of 1. Hope that makes sense..
edit: post deleted
There is a delete post option.
I only really bothered with what I knew to be common choices, and tried to avoid duplication between specs with no huge difference.
I think the one you linked would slot in slightly less than the 10/25/0/10/25 build, due to it being 5 percent less dmg mods from zeal but 10 more dmg mods from radiance, plus the 100 power for 250 precision.
And yes, where applicable I only consider zeal 2, zeal 7, virtue 6, virtue whatever the condi removal is, 1h dmg/crit and sup aria.
Well it turned out to be an interesting chart. Thx for the work.
Thought this might be useful to some people.
I’ve put a selection of specs into my own personal effective power spreadsheet to find out each spec’s relative damage in comparison to base stats (916 pwr, 4% crit etc).Some variables you may want to know:
I assume 5 percent damage from virtue 25.
I assume 100 percent fury up time.
All specs besides the obviously hammer ones (at least 20 in night honor) receive 2 extra stacks of might.
Gear is always zerker and ruby orbs or soldier and traveler runes, represented by either a Zor an S on the vertical axis.
Where weapon swap is worth it, I assume 60:40 ratio of greatsword to 1h sword.The gaps would widen if you add might stacks, sigil of force, and scholar runes.
What type of calculations did you do to arrive at these projections? Were there actual damage calculations? Would you be willing to provide a link to the actual spreadsheet or calculator so that we could duplicate your results?
Thanks for your consideration.
What type of calculations did you do to arrive at these projections? Were there actual damage calculations? Would you be willing to provide a link to the actual spreadsheet or calculator so that we could duplicate your results?
Thanks for your consideration.
It’s a bit convoluted since I don’t actually use the website but here goes.. I’ll get some reproducible results for you.
Go to gw2 buildcraft and put in exotic zerker armor, ruby orbs, ascended zerker trinkets, and an exotic zerker weapon, then go to the ‘manual’ tab and add 9 more power, 6 precision, and 1 critical damage. This is to emulate the ascended weapon without the damage modifier attached by that website.
For buffs pick 2 might stacks (to represent greatsword over hammer) and 100% fury uptime. For consumables pick truffle steak (pwr/prec) and master maintenance oil.
Then go ahead and trait 20/30/0/10/10, picking the relevant damage traits.
You should now be at 2469 power, 2200 precision, 916 toughness, 1016 vitality, 82% bonus critical damage, 85% chance to crit and a 27.05% damage modifier. This should result in an effective power of 6688 when using 2h and 7341 when using 1h.
916 is always your base effective power. If you reset that website you can see it gives you an effective power of 934 due to the base 4% crit.
Divide 6688 by 916 which is your base effective power as mentioned above and you get 7.3 for 2h. Divide 7341 by 916 and you get 8.
Consider that I said I believe greatsword to be 60% of your dps and 1h to be 40% of your dps in a proper WW/Symbol/1h auto rotation…
So (0.6 * 7.3) + (0.4 * 8 ) = 7.58
7.57 is the relative damage multiplier I have listed for zerker gear in the graph for the 20/30/0/10/10…. so allowing for rounding errors on the way there’s one of the reproducible results. You should be able to do a similar thing for the other numbers if you want to.
Scholar runes, more might stacks, vulnerability, damage multiplier sigils etc should all see the gaps between specs widening.
(edited by fadeaway.2807)
Would like to see Knights armor included in this chart, for comparison purposes.
Would like to see Knights armor included in this chart, for comparison purposes.
Without getting into a gear choice argument and semantics, Knights armor isn’t really the goto DPS gear choice. It’s more of a hybrid DPS/Bunker choice.
Would like to see Knights armor included in this chart, for comparison purposes.
Without getting into a gear choice argument and semantics, Knights armor isn’t really the goto DPS gear choice. It’s more of a hybrid DPS/Bunker choice.
I think he just wants to see the common armor type compared to the other two. That chart includes Soldier vs Zerker. Though I’d be interested too, in seeing if the training wheel version of the meta is decent or not.(since we all knew soldier would be trash, even so its nice to see the number difference).
Opps, I forgot that, so yeah, it would make more sense to add a common gear choice in.
I think he just wants to see the common armor type compared to the other two. That chart includes Soldier vs Zerker. Though I’d be interested too, in seeing if the training wheel version of the meta is decent or not.(since we all knew soldier would be trash, even so its nice to see the number difference).
Exactly. We all know the DPS in Knights is going to be lower. But it would be interesting to see exactly how much lower it actually is across the spectrum of trait builds.
Curious about the data behind the chart. Would you be able to do a googledocs of it so I could poke at it and try some of my own builds and theorycrafts?
Ahh I’ll see what I can do tomorrow. It’s not pretty but the math is fairly simple and appears to work. I’ll need to make it look a bit more presentable and easy to use..
That’s fine, my own spreadsheets would make sense to no one, but I’m willing to put effort into your work because other points of view may show me something I didn’t even consider.
If you do have it available that would be awesome!
I disagree with a lot of your assumptions and your results. You cannot translate effective power directly into dps, especially with builds using different weapon sets and averaging out a swap is meaningless because the effective power of a Sword does not have anything to do with the Effective Power of a gs.
If you were so inclined …
What I find interesting is the difference in gear sets for a particular build. You provide that with Soldiers/Zerker. I think it would also be telling for Cleric and Knights. I think anything else can be extrapolated.
I’m not sure what method you used to come up with your values but it may be more informative to present the actual power value you get, as well as the % increase in damage due to your (crit chance,crit damage) co-ordinate for a given gear/trait choice. Your numbers pass my litmus test as well:
Going from Soldiers to Zerker in a 10/20/0/5/25 results in an increase of 72% … I check the chart from GW2wiki for that increase, find it’s in the range of 50% crit change and 90 crit damage … and conclude that makes sense with values I see in full zerk.
Very informative work. If a whole body of work of this quality could be made for DPS, it would be a very sticky worthy post. mt only suggestion based on my own self interest is to focus on differences in gear, not traits. Hard for me to demonstrate wihtout a proper chart but really, I’m suggesting a simple table that would have a column for gear, a column for resulting power, column for crit co-ordinate and column for final normalized damage to the baseline. I don’t even the traits are necessary to include. Don’t confound too many variables.
(edited by Obtena.7952)
Nike, if you have any suggestions on what might offer better assumptions to create a better scenario to compare builds I’ll be happy to incorporate them.
The reasoning behind the 1h vs 2h averaging out was that if I take the standard rotation of ww, symbol, auto, ww… swap to 1h for ten secs then back to gs to repeat.. using the appropriate skill coefficients I found that the gs does a bit more than half your damage (roughly two thirds), even taking into consideration the higher stats of the 1h due to traits. Therefore I multiplied the gs figure by that amount and the 1h by the remaining percentage to arrive at an average. There may be a better way to do this, I don’t know.
Essentially all I’m trying to do here is prove the rather large gap between builds focusing on the damage percentage traits vs builds focusing on honor or valor. It’s fairly easy to guess and prove, but some people like to see in easy to view forms.
Essentially all I’m trying to do here is prove the rather large gap between builds focusing on the damage percentage traits vs builds focusing on honor or valor.
Your chart says more about the effect of taking Radiance deep, rather than saying a whole lot about Honor or Valor.
Where would hammer 15/25/0/20/10 fall?
Well… I had a much more elaborate write up, but I closed the tab I was typing in while fumbling with my music …
…
Anyway, the way you present your data is too arbitrary. Unfortunate we don’t have an effective way to evaluate a “relative” damage comparison without using made up rules – base stats can effectively be ignore as you can assume everyone has at least the base stats. Anyway, you are better off compiling comparisons of various trait sets and gear sets (Full Zerk vs. Full Soldier, using Build Q) and comparing their effective power after traits. At least when presented that way, it is just raw data (though, the typical user may not understand “effective power” as a concept) which does not have to be interpreted. Regardless, if you are going to use the method above, be sure to document (and share) how you developed the information. A few things to keep in mind: Buildcraft does not currently do anything to the damage multiplier when using Virtuous Power, you have to manually add 8% in the “manual” tab. Also, if you are going to use builds that have Virtuous power, do be sure to include Unscathed Contender as one of the chosen traits. It is our most powerful damage trait and shouldn’t be overlooked due to its difficult upkeep.
I’ve included a screenshot of something I was throwing together in Excel as an example of what I’m trying to communicate to you, unfortunately, it is somewhat out of context as I don’t want to retype my lost response (admittedly, I’m lazy and spend all day typing anyhow) again. Edit: Made a noob mistake and didn’t label the axis, but the top set of bars are Soldier Gear, bottom set are Berserkering.

(edited by Kelnis.1829)
snip
Again, I humbly request that folks include Knight’s in these charts. I’m honestly curious to see how it stacks up.
Problem: You forget about stacks/food/etc. and seem to make "weird" assumptions. 10/25/0/0/25 is definitely more damage than 20/30/20/0/0.
I can’t cater for every scenario. Data dependant on bloodlust stacks, might stacks, scholar vs ruby, different types of gear.. all these together would result in hundreds of results which I just don’t have time for. If you have any suggestions on the assumptions which you think would better reflect standard gameplay then I’ll happily swap to that. I’ll look to get the spreadsheet made available today so you can try things for yourself.
I am “trying” to make a scaleable spreadsheet that gives allowances for stat input to show approximate dps.
The problem I"m running into right now is I began to include number of hits made in a duration, and was using that to determine the number of VoJ procs as well as to average out based on crit chance, just how many hits crit and how many didn’t (so you could split the difference and multiply the non-crit hits with non-crit damage and the crits with the crit damage)…………..but now I have a scenario where attacks of multiple hits of varying damage, so factoring in just exactly what hits are crits and not changes a lot of things
At most I could go back to assuming 100% crit chance on everything and still include the burn damage based on number of hits…but I"m not happy with that because different crit chances make or break various builds. I could have 200% crit damage and 0 crit chance and it would do no damage.
You can just take an average, you can’t calculate real dps anyway since that is just rng.
@fade: You seem to use unscathed contender as 0% increase, why? In arah p2 as example it has 100% uptime at brie, abomination, 50-100% at lupicus, 80-100% at alphard and 100% at brie. In arah p3 100% at crusher/hunter, 100% at mage crusher, 50-100% on lupicus and well, about 10-30% on wraithlord if he likes you.
Also the assumptions (might, fury) widen or smaller the difference between builds.
With high power but low precision, RHS is extremely strong, assuming perception stacks, banner and fury it’s almost worthless and with spotter it has zero effect.
(edited by Anicetus.1253)
Personally I’m not good enough to keep unscathed defender up.
I’ll include an option to toggle it on for you.
it doesn’t really need to be up all the time for it to make a pretty noticeable difference in your DPS. even baddies like me can get a good boost out of it.
https://docs.google.com/spreadsheet/lv?key=0AlCaXk6xwXSkdGFBbHB2ZkF2a2luaFk5UVJlQUh6WHc
There’s the spreadsheet. It’s a port from excel so there might be some issues. There are drop down boxes for weapons, armor, trinkets, runes, sigils, food, consumables, and other variables such as bloodlust, might, fury, power of the virtuous, unscathed contender, banners, spotter, vulnerability,etc.
Some pictures of the graph output attached. One comparing soldier, knight and zerker across specs.. the other pic shows how the specs scale with a maxed out scenario.

Can’t seem to attach two pics in one post.
Here’s the maxed out (scholar, might, vuln etc) comparison.
Notice that although the proportions between specs are similar, the numerical differences are actually quite big. And the numbers in general are much higher than the non maxed out ones for obvious reasons.

(edited by fadeaway.2807)
Can’t seem to attach two pics in one post.
You can attach multiple pictures in the post.
Attach first picture, click on Preview and you will see another “Choose File” button, use it to attach 2nd picture.
Oh I just noticed a mistake with the labels on the graphs.
The gear combinations I tested were zerker/scholar, zerker/ruby, soldier/traveler and knight/ruby. I accidentally listed soldier as being tested with ruby orbs. I’ll update the spreadsheet but the attached graphs will still have the wrong label.
(edited by fadeaway.2807)
Not affiliated with ArenaNet or NCSOFT. No support is provided.
All assets, page layout, visual style belong to ArenaNet and are used solely to replicate the original design and preserve the original look and feel.
Contact /u/e-scrape-artist on reddit if you encounter a bug.